
Improve Churn Rate With Google Sheets and Prediction API

Predicting future events has never been easier, thanks to machine learning concept. It does predictions based on historical data.
Let’s take a look at sas.com machine learning definition:
“Machine learning is a method of data analysis that automates analytical model building. Using algorithms that iteratively learn from data, machine learning allows computers to find hidden insights without being explicitly programmed where to look.”
Yes, machine learning is behind all these cool stuff we use:
- Self-driving cars (near future)
- Recommendation systems you see at Amazon and Netflix
- Fraud Detection
- Spam Detection
- Estimating credit risk
- Google Translate
- Upsell opportunities
It finds you patterns that exist in places you would never consider.
You don’t need to do anything. Big shots like Google, Amazon, Microsoft, BigML and others, have invented the algorithms for you. That’s why it’s affordable to anyone.
Basically, your job is to prepare the data and use the API.
#1 Google Prediction API
To predict customers that might churn, I’ll use Google Prediction API combined with Google Spreadsheets.
Now let’s take a look at Google Prediction API pricing.
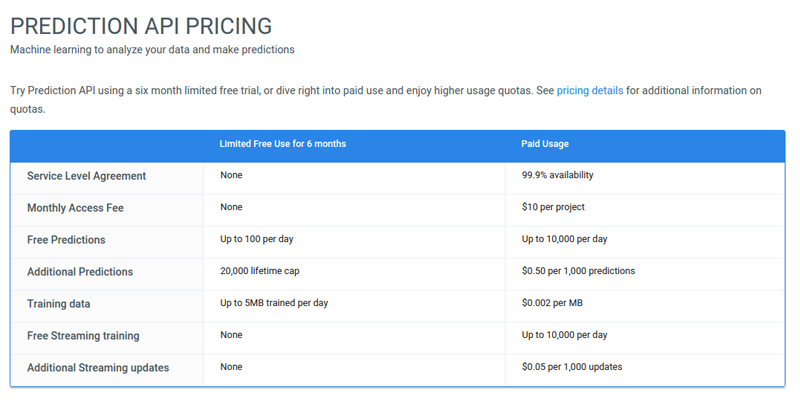
For the $10 per month, you’ll get 10,000 predictions per day and every additional 1,000 predictions will cost you $0.50. Also, 1GB of training data is $2.04. I told you it’s not expensive, didn’t I?
In this example, forget about pricing. We’ll install a Smart Autofill Add-on and predict users that might churn for free.
#2 Predicting Churn Rate
As you have figured it out by now, ML makes it possible to answer the question we’re interested in:
What is the possibility for the customer X to cancel a subscription in the next 30 days?
For every single client, you’ll get a prediction. Amazing, isn’t it? In this example, I’ll use publicly available data set from Orange Telecom.
I suggest you try and test ML with the data set from Orange Telecom. Once you figure out everything, you can use your own dataset.
#3 Install Smart Autofill Spreadsheet Add-on
Let’s install Smart Autofill Spreadsheet Add-on. Please don’t forget that API is a better solution.
There are different libraries available (PHP, Python, Ruby, .NET, Go, and so on) so it won’t be a problem to predict whatever programming language you or your developer are using.
How can I install Smart Autofill SpreadSheet Add-on?
Step #1
Open the Smart Autofill Add-on page and click on the + FREE button.

The other way would be to create a new spreadsheet document, and in the menu click on Add-ons - Get Add-ons. In search, hit “Smart Autofill” and click on the + FREE button.

Step #2
Let Add-on have permissions to access your account.

Click on Allow, wait for couple of seconds and check if the following message appears.

#4 Prepare the data set
Download the 80% of the Orange Telecom dataset and import it into Google Spreadsheets.
The reason why we use 80% of the data is that because we’ll train it as a model.
The rest 20% of the data will be used for predicting.
If you have a dataset on Google Driver, you can use it as a source without uploading a new document. I’ll upload the dataset from the computer since I don’t have it on my Google Drive.
Now, let’s go to File - Import, choose Upload tab and upload the dataset.

Great. Now we have a historical data and lots of columns.
All these columns, except one, are actually independent variables (X). The last column is our dependent variable (Y) - the variable we’re predicting.
Take a look at Independent variables:
- State
- Account length
- Area code
- International plan
- Voice mail plan
- Number vmail messages
- Total day minutes
- Total day calls
- Total day charge
- Total eve minutes
- Total eve calls
- Total eve charge
- Total night minutes
- Total night calls
- Total night charge
- Total intl minutes
- Total intl calls
- Total intl charge
- Customer service calls
and the dependent variable is called CHURN and has only two possible values:
- True
- False
As you’re guessing, dependent variable CHURN is determined by all these independent variables X.
Now when you’ve imported 80% of the data, we need to import the rest 20% data.
Download the 20% dataset that we’ll use to determine if our customers will churn or not. Importing the rest 20% data goes the same way.
Go to File - Import and upload a file with rest 20% of the data.
We’ll be asked to choose the import action:

I’ll choose to Append rows to current sheet.
Please make sure that your current sheet is the sheet where 80% of the data (model data) is.
Click on Import and this is how your spreadsheet document should look alike.

Obviously, I should remove the row 3335 because it’s useless - there are column descriptions in the first row.
However, the data is still not ready.

I need to remove values of churn column (TRUE/FALSE) from appended, 20% data.
I want my table to look like this.

I could have cleaned the data before importing.
The final result will be the same, so you can choose whatever you like. Now, let’s predict the future!
#5 Prediction
From the menu, click on Add-ons - Smart Autofill - Start.

In the right part of the screen, Smart Autofill window should appears.

Before I click on the Next button, I have to select all rows and columns (churn column too) I’m using for prediction: Click on the cell A2.

Scroll to the latest row (4003), press SHIFT key and click on the latest cell T4003.

Please note that I have two empty rows between 80% and 20% data sets. If you have only one, then your latest row will be 4002. If you don’t have empty rows, your latest row will be 4001.
Now when you’ve selected rows and columns, click on the Next button, and choose the column to Autofill. In this case, it’s a column T.

You can highlight predicted values if you wish.
This is especially good if you don’t have empty rows between model data and data to predict - our 80% and 20% files.
Click on Start and prediction has started. Due the large amount of data, predicting could take a while.
That’s the reason why API is a better solution since it lets you predict in less than 200 ms for the most cases.
The Smart Autofill Add-on is a really great for testing purposes, but API is the solution you need for more advanced predictions.
#6 Results
OK, we got the results.

Our estimated accuracy is 87.00%. It’s good but far from perfect. Estimated accuracy would be greater if the sample (model) was a bit larger.
However, column T should be filled.

That’s it.
Conclusion
ML is becoming more and more popular because it use real cases. It’s the future.
Lots of data are waiting to be processed and hidden patterns to be found. As I’ve said at the beginning, machine learning is available for everyone.
You don’t need to have programming skills or big money to use it. BigML, Machine-learning-as-a-Service, is also a great solution.