
Components of Quality Score That Matters a Lot

Google earns whenever someone clicks on your ad through their advertising system Google Ads. For that reason, they want to provide the best ads to its users.
Better results they provide, more clicks they charge. Google Ads is actually a triangle with the following three angles:
- Google company
- Advertisers
- Users
Users want to see the best search results (including paid results). Advertisers want to drive the most relevant users to their landing pages (and pay as less as possible too).
Google wants to earn as much as possible so they’ve invented a metric called Quality Score. Quality Score helps them to understand which ad is better to display to visitors.
Quality Score has three components:
- Landing page experience
- Ad relevance
- Expected CTR
Here, I’ll explain you each Quality Score component and show you what you need to pay attention to. Furthermore, I’ll show you how to check your Quality Score during the history too.

This way, you can understand what type of changes have an impact on the Quality Score, so you can focus on it.
Let’s start!
Landing Page Experience
One of the best landing page experience indicators is a bounce rate.
Bounce rate is the percentage of people who left your site without any further interactions. Here’s the bounce rate formula from Kissmetrics.
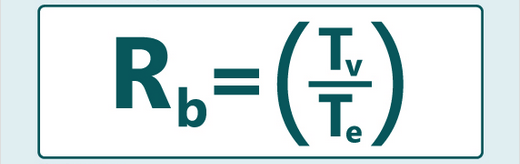
Rb – Bounce Rate Tb – Total number of visits viewing one page only Te – Total entries to page Having a high bounce rate means that visitors are not satisfied with the landing page to drive them to.
In other words, you have to optimize it (which I’ll explain later) or you’ll lose your money on Google Ads.
Again, Google wants to provide the best user experience to its users and if a bunch of visitors hate your site, Google will hate it too. Now, in Google Analytics click on Behaviour - Overview.

There, you’ll see what’s your bounce rate.
The question is - what an average bounce rate you should have?

It depends a lot on the type of the site. Here are some benchmarks:
- Content websites 40-60%
- Lead generation 30-50%
- Blogs 70-98%
- Retail sites 20-40%
- Service sites 10-30%
- Landing pages 70-90
But, wouldn’t it be interesting to dig deeper and see which pages have the best bounce rate? If you agree, click on Behaviour - Site Content - Landing Pages.

The list is here.
Now you can identify which pages have the best bounce rate and which don’t.

Once you know how to check a bounce rate, let’s discuss which specific activities you should apply in order to increase a landing page experience.
Website Speed
Abandonment rate is what every E-commerce owner hate, but what are the reasons of abandonment rate?
The first reason are unexpected costs. But, one of the reasons are website crash and website time out.

In fact, a fast website is good for SEO too.
Pages that rank on first few positions have the website speed around 2000 ms.

Google has built a PageSpeed Insights tool which tells you which mistakes your developer has made. In the URL field enter your domain name and click on ANALYZE.

Results will come within a couple of seconds.
Here are the results for jellymetrics.com.

Our site has 78/100 grade for Desktop devices which means there’s a space for improvements we should pay attention to.
Mobile Responsivity
There’s no Internet user who doesn’t use a mobile device.
Today, most emails are opened on mobile devices which means you have to be ready for the mobile era.

It used to be unthinkable that Facebook will earn more from mobile advertising than desktop advertising.

But, things have changed. Mobile Internet is much faster today and basically, we do lots of stuff on our mobile devices.
That means you need to prepare your website for mobile devices and you can test if your site is mobile ready by using Mobile-Friendly Test.
So, in the text field just enter your site address and click on RUN TEST.

Within a couple of seconds, you’ll see if your site is mobile-friendly or not.

This is especially good if you don’t have a tech background and most of the digital marketers don’t have it.
Add Testimonials
Every landing page must be trustful. Potential customers must recognize you as someone they can trust.
There’s no better way than showing who are your current customers. Here’s what HubSpot does.

They show how they have top customers like Shopify, usabilla, Tufts, and so on.
This way, HubSpot is able to increase a conversion rate. Simply said, it makes their landing page experience much better and finally, their Quality Score definitely goes up.
BuzzStream is another great company which has moved a step forward and displayed a few sentences about their business from digital marketing experts.

Rand Fishkin is a well-known SEO expert, so when such a great influencer says that your product adds immediate value, then it means a lot.
Do it for your own company.
Ad Relevance
As you already know, ads are the important part of Quality Score. The thing with ads is that they must be relevant to the search query.
Google has three grades that tell you if an ad is relevant or not:
- Above average
- Average
- Below average
Take a look at the following photo.

Does it look relevant to you? For me, it doesn’t. I was searching for keyword research tool and AdWords has returned me some research methodology, and digital marketing education.
Not interested. The ad isn’t relevant to me, so Quality Score will definitely go down because I think it won’t be relevant for others too.
But, take a look at the following photo which shows the ad displayed for help desk software query.

The ad is very relevant to me. In fact, it’s exactly what I was searching for and there are two very important things:
- Headline
- Ad description
Headline contains searched phrase and description contains as well.
Furthermore, a PPC specialist has added lots of interesting information in the ad. Information such as the number of customers, countries where the business is active, CTA, price, and so on.
SKAG
The best way how you can handle relevance is to limit the number of keywords. Google suggests creating 5 - 20 keywords per ad group.
For best results, we recommend picking between 5 and 20 keywords for each ad group. Once your ads start running, you can evaluate how your ads and keywords are doing and make any adjustments to improve performance.

I don’t recommend that. I’d recommend you to follow SKAG tactic. It stands for Single Keyword Per Ad Group.
The idea is very simple. For each keyword, you’d like to target you must create a unique ad group and an ad into that.
This requires lots of work, but I think it’s worth. This way, you’ll be able to create really relevant ads to the keyword(s) you pick.
One more thing: don’t pick broad modifier match. This will target lots of keywords so it’s not worth especially when there are high search volumes.
A/B Tests
The best way to check what’s the best for Ad Relevance (and Quality Score) is by performing A/B tests. For those who don’t know what A/B tests are, the idea is to split the traffic by creating two different versions of ads.

Once you do it, you’ll see what works better for you. You can do the same thing for landing pages too.
However, you need to worry about something we call statistical significance. Every decision made on data must be statistically significant.
Otherwise, everything is useless. A classic lottery. No worries, you don’t need to dig deep into statistics although it might be useful.
Anyway, there are lots of free calculators where you only have to enter exactly four numbers:
- Clicks (version A
- Impressions (version A)
- Clicks (version B)
- Impressions (version B)

After you do it, you’ll see which ad version provides better Ad relevance.
Quality Score will be increased when your real (current) Ad relevance is better than historical Ad relevance (you’ll read more on it later).
Expected CTR
CTR is very important part of Google advertising because Google wants to provide results that people are willing to click.
They charge advertisers per click and they aren’t interested in showing ads like I just mentioned (keyword research tool). In order to display relevant ads, they’ve invented the third component of Quality Score - Expected CTR.
Simply said, they will calculate what’s your expected CTR. Obviously, they have so much data so they can estimate everything about your ads. Here are some basic benchmarks.

The better ad position you achieve, the more clicks you’ll get.
That’s so obvious.

Source: E-Strategy Blog
Consumers usually watch top results and they have the highest CTR. Here’s what WordStream says about positions and its CTR:
- Position 1: 6%+
- Position 2: 4-5%
- Position 3: 2-3%
- Position 4: 1-2%
- Position 5 and lower: 1%
Google allows you to check exactly what’s your expected CTR, ad relevance, and landing page experience.

In the past, all these metrics haven’t been available, but now it’s available thanks to the recent changes. For example, you can compare your currently expected CTR and historically expected CTR.
Simply said, you can see how small changes may increase your expected CTR. Ad relevance and landing page experience too.
Having a CTR below the expected will lower your Quality Score for sure. But, what you can do to improve a CTR? Here’s what.
Ad Extensions
Firstly, use Ad Extensions. Just as the name suggests, Ad Extensions will extend your ad with additional pieces of information such as phone number, address, store rating, etc.
There are two groups of ad extensions: Manual extensions Automated extensions I always recommend using manual extensions because they give you a maximum control of it.
Here are some of them:
- Location extensions
- Affiliate location extensions
- Callout extensions
- Call extensions
- Message extensions
- Sitelink extensions
- Structured snippet extensions
- Price extensions
- Review extensions
- App extensions
Also, here’s the list of automated extensions:
- Automated location extensions
- Consumer rating extension
- Seller rating extensions
- Previous visits
However, if you want to go with automated extensions, then I suggest implementing Schema.org so Google can better understand your site.
I’ve found a SlideShare presentation which says that using sitelink extensions may increase a CTR by 64%.

The math is simple. Better CTR = Lower CPC.
Here’s how site extensions look on mobile devices.

When user searches for new york call a cab he’s just 1 click away from calling a cab.
As you can see, ad extensions don’t increase CTR only because they increase a conversion rate too.
If you have great services and reviews, it would definitely be a shame not to show it to the potential customers (check the photo above, again).
Use Magnet Words
Some keywords - known as magnet words - may boost your CTR too. Take a look at the photo below to see that keywords.

People have different reactions on different keywords. Which keyword will work the best for you depends on a variety factors.
However, one thing is for sure: you have to test it.
Conclusion
So, there are three components of Quality Score:
- Landing page experience
- Ad relevance
- Expected CTR
It’s impossible to say that one component is more important than another. For example, you can have incredibly relevant ads with enormous CTR, but if your landing page isn’t what it should be, then everything becomes useless.
So, every component is equally important but you can start from the landing page because it’s supposed that your landing page is created before you start creating an ad.
Before that, you can do a keyword research, so you can know what landing page you should create.
Finally, give it some time. Quality Score is something that changes over the time which means it’s something that can be optimized, again. How long should it take? I think that every campaign should be performed for at least few weeks.
Of course, you won’t waste your money if your landing page is horrible and doesn’t convert at all, but if your CTR is 1.0% and you want it to be 1.5% then you can be patient for a few weeks.